JupyterLab and Colab Notebooks#
Installation#
To install the TensorBoardPlugin3D python package inside the notebook:
!pip install tensorboard-plugin-3d
Usage#
This documentation uses the spleen_segmentation_3d tutorial notebook
provided by MONAI as a starting point and demonstrates how to expand on the
notebook to take advantage of the 3D plugin with only a few additional lines.
See the bottom of this page for links to available example notebooks.
Plot Images#
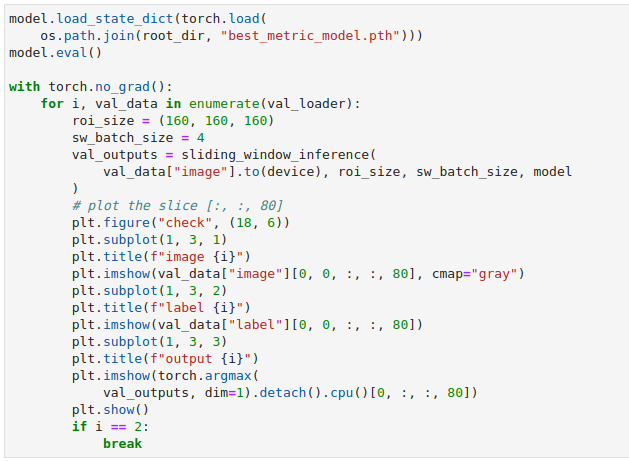
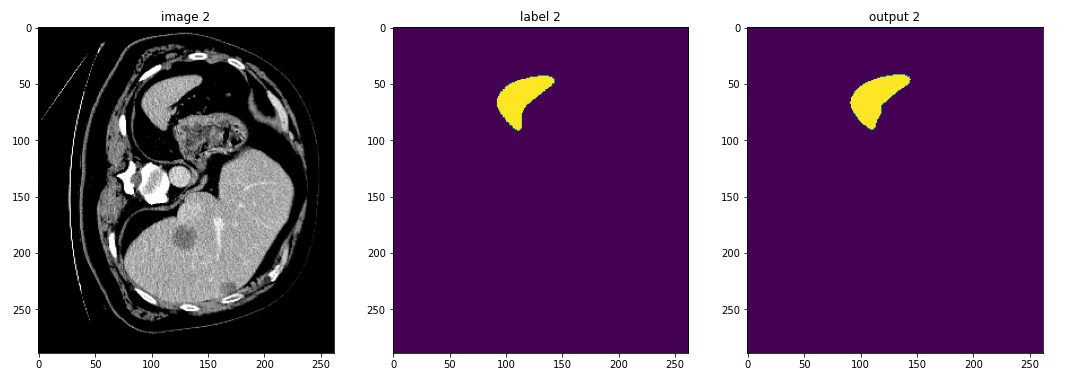
MONAI provides plot_2d_or_3d_image and the related ignite handler to plot
the 3D image in TensorBoard. Originally the output model and input image and
label could only be visualized with matplotlib which limited the view to a
single slice at a time.
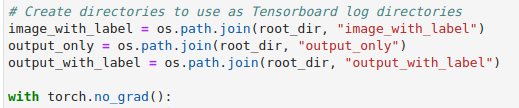
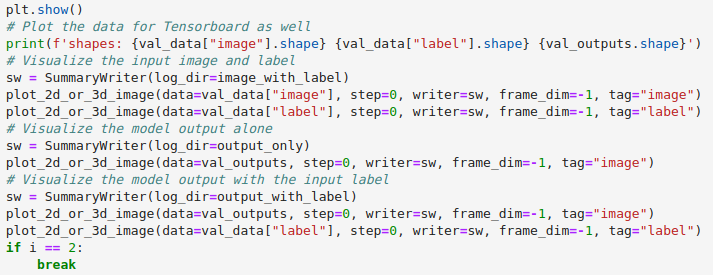
For the purposes of this tutorial we will write out multiple views to get an
idea of the different ways we can visualize data. Outside of the loop (above
the torch.no_grad() call) we will create directories for each combination
of input and output we would like to view. TensorBoard takes in a directory as
the logdir to read from, so creating separate directories simplifies
selecting which data to display.
Within the loop we can then add the calls to plot_2d_or_3d_image to create
the event files that TensorBoard will need.
The call to plot_2d_or_3d_image takes several parameters:
- data
Target data to be plotted as image on the TensorBoard. The data is expected to have
NCHW[D]dimensions and only plot the first in the batch. This shape is important and required to write out the full 3D image.
- step
Current step to plot in a chart.
- writer
Specify a SummaryWriter to plot the image. You should create a new SummaryWriter object for each new image or image/label pair that you create so that they are grouped together.
- frame_dim
Specify the dimension used as frames, expects input data shape as
NCHWD. Defaults to -3 (the first spatial dim). For our use case we will pass in-1to use the depth dimension.
- tag
Tag of the plotted image on TensorBoard. This is used by the plugin to determine which is an image and which is a label.
Of the parameters passed to plot_2d_or_3d_image there are three especially
important pieces to plotting the images so that they work with the plugin:
The
SummaryWriter. A new SummaryWriter should be created for each image or image/label pair, even if all of the data will be written to the same directory. This creates a new event file for each image or pair of images which is what the plugin uses to determine which data to associate with what.The
data. As explained above, the data that is passed in is expected to haveNCHW[D]dimensions. If the data does not match this shape, PyTorch provides anunsqueezemethod that can be used to insert a dimension of size 1 inserted at the specified position.The
tag. This must be set to eitherimageorlabelto indicate the role of the data. Without this images may not be shown with their label or may not be displayed at all.
Select Images to View#
To select which images to view simply pass the directory to the TensorBoard
logdir flag.
%load_ext tensorboard
%tensorboard --logdir=$output_with_label
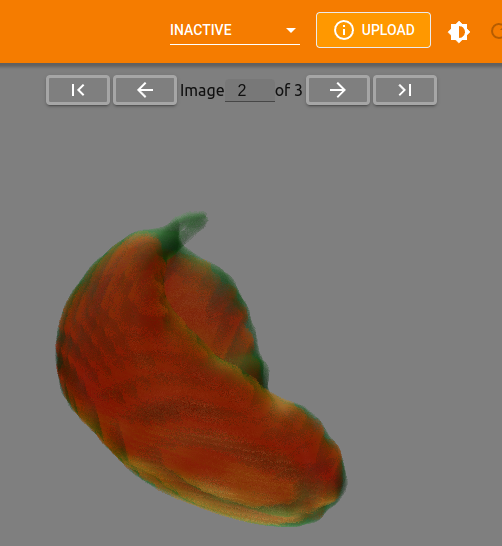
The plugin will display the most recent image data first. Each of the three
directories created should contain three images or image/label combinations, so
pointing to any one of them will provide three images that can be viewed. If,
however, the logdir were set to be root_dir instead, only the most
recent from each of the child directories would be available to view.
Switching Images#
If multiple images are available within the selected logdir there will be
an option to toggle between them or jump to a specific image.
Any and all settings that are applied to an image are carried over to the next image as well. This allows you to get the vis settings just right before flipping through available images and comparing results.
Example Notebooks#
UNet Segmentation 3D Ignite
Quick example notebook demonstrating 3D segmentation with UNet. This notebook uses simple demo data and is a great starting place if you want to see the whole training process and output together without much wait.
Spleen Segmentation 3D
spleen_segmentation_3d: Demonstrates 3D segmentation of a spleen dataset. Training in this notebook takes a bit longer than the UNet example but is a great example of segmentation and medical imaging. Run this notebook the whole way through to get a feel for the flow between the training process and viewing and analyzing the output model in TensorBoard.
cached_spleen_segmentation_3d: This notebooks provides the cached data from the Spleen Segmentation notebook in order to allow you to quickly load and view the output models in TensorBoard. This is a great starting point if you would like to quickly begin viewing and analyzing actual medical data.
Brats Segmentation 3D
brats_segmentation_3d: Demonstrates 3D segmentation of a brain tumor dataset. Like the Spleen Segementation, training in this notebook takes a bit longer to run but is another great example of segmentation and medical imaging. Run this notebook the whole way through to get a feel for the flow between the training process and viewing and analyzing the output model in TensorBoard.
cached_brats_segmentation_3d: This notebooks provides the cached data from the Brats Segmentation notebook so that you are able to quickly load and view the output models in TensorBoard. This is a great starting point if you would like to quickly begin viewing and analyzing actual medical data.